Dashboard
When you first start using HelpGuides, opening a project will take you to the Content tab. Once you’ve published content and your articles begin collecting metrics, you’ll automatically be directed to the project Dashboard instead.
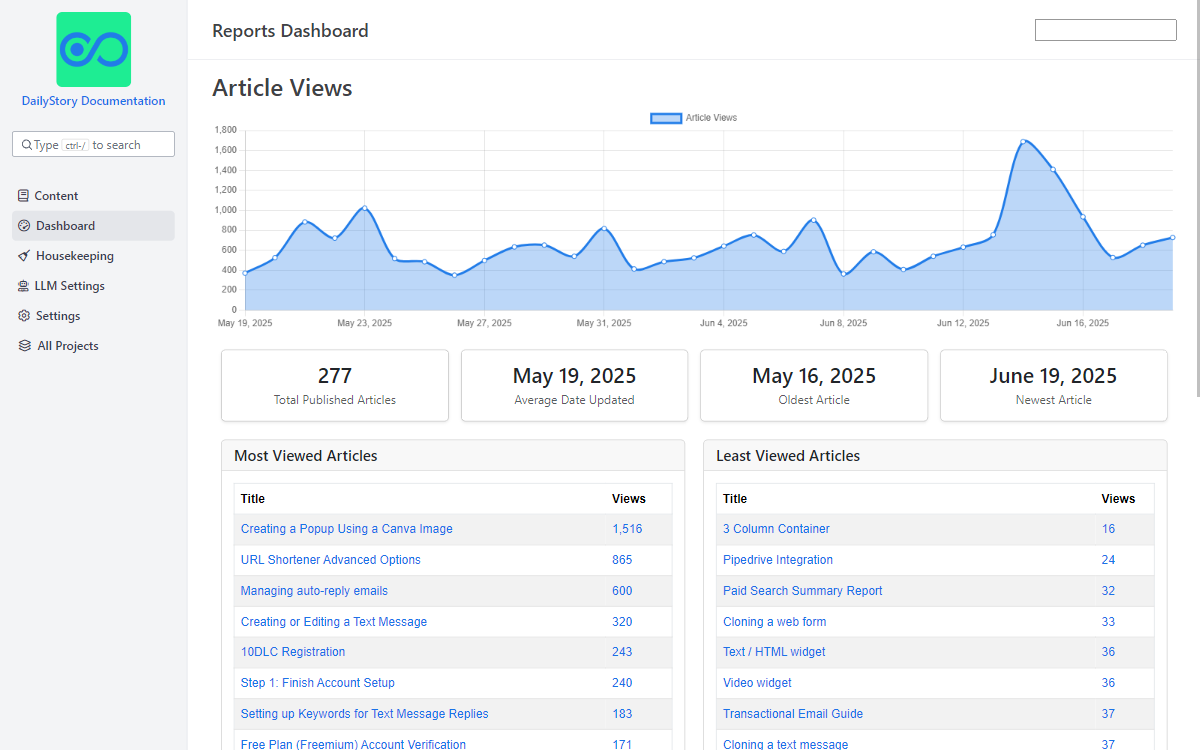
The dashboard provides quick access to all of your articles along with graphs to help you understand how your article views.
ImportantSome of these reports are not shown if there is no data for a given dashboard.
Article Views
This provides a graphed view of views for all of your articles.
Article Metrics
This includes the total number of published articles as well as some metrics around the age of your published articles.
Most Viewed Articles
The top 10 most viewed articles. This gives you an idea of which articles are most popular.
Least Viewed Articles
The top 10 articles with the least amount of views. This gives you insight into which articles may be underperforming.
Recent Searches
Provides insight into recent searches performed along with the keyword or phrase that was searched for. This can help provide insight into popular topics are areas that customers may be having problems with.
Search None Helpful
When search results are returned an option "None Helpful" button is shown. When clicked, this logs and is reported here. This provides insight into searches that didn't return the expected results or the user was unable to find an answer to their problem.
Helpful Articles
Articles that readers marked as helpful.
Not Helpful Articles
Articles that readers marked as not helpful.